The institution
provides an executive summary of no more than three pages, which describes the
institution’s framework for its ongoing accreditation efforts. This might
include evidence of institutional effectiveness, Core Themes, or other
appropriate mechanisms for measuring fulfillment of its mission.
The mission of Olympic
College (OC) is to enrich “our diverse communities through quality education
and support so students achieve their educational goals.” In the 2018 Mission Fulfillment
and Sustainability evaluation, OC measured mission fulfillment based on
meeting or exceeding the thresholds established for its Core Theme indicators. Considering
the changes to the NWCCU standards that no longer required Core Themes, OC
opted to align its mission fulfillment indicators to the current Strategic Framework
instead of Core Themes. Table 1 shows
the crosswalk between the Core Themes and Strategic Framework.
Table 1.
Crosswalk of Core Themes to Strategic Framework
|
2018 Core Themes
|
2021
Strategic Planning Framework
|
|
Student
Learning and Quality Teaching
|
Teaching and
Learning
|
|
Student
Access and Support
|
Student
Access and Success
|
|
College
Environment
|
Campus
Climate and Intergroup Relations
|
|
Community
Enrichment & Responsiveness
|
Institutional
Capacity Building
|
The previous Core Theme indicators and measures were reviewed by
the Accreditation Leadership Team and revised as needed to reflect relevance to
the Strategic
Planning Framework, meaningfulness of the measure to mission fulfilment,
and data accuracy and availability. To
support the Strategic Planning Framework, new indicators have been added while
others are still being considered. Some indicators have been expanded including
completion data that is now disaggregated to evaluate equity gaps.
Baccalaureate degree data now includes on-time and total completions. Basic
Studies outcomes have been expanded to include credential/diploma attainment
and employment. Other indicators have been revised to address changes to the
data sources including faculty course evaluations and employment after
graduation. Examples of indicators no longer considered viable include graduate
and employer surveys with low response rates and transfer student graduation
rates that are no longer available. The data and brief analyses are available
in Appendix A.
OC’s mission
requires a commitment to serving the educational needs of the service area and
its diverse community. Student access and success incorporates goals for
equitable enrollment, progression, completion, and achievement for groups that
have been historically underrepresented. In the 2018 Mission Fulfillment
report, data was included for part-time and full-time; however,
because student status can vary quarter to quarter, this data is not consistent
or meaningful. Indicators include course completion rates, pass rates on
standardized and national exams, baccalaureate degree completion, basic studies
outcomes, and employment for professional-technical completers.
Teaching and Learning
Teaching and
learning have always been the central focus of OC. Student perceptions of
instruction and quality of relationships with instructors are important to the
ongoing assessment of teaching effectiveness.
Indicators include course evaluations and the Community College Survey
of Student Engagement (CCSSE) survey. Professional development of faculty
impacts student learning when faculty bring their interests, enhanced skills,
and competencies back to the classroom to enrich the learning environment.
Indicators include faculty participation in a variety of development and
training that support equity efforts.
Campus Climate
and Intergroup Relations describes the psychological and behavioral environment
of the campus. Providing a campus climate that is welcoming to all is vital to
OC’s
mission to enrich our diverse communities. Beginning in 2022, all
Washington community and technical colleges must have strategic plans for
achieving diversity, equity, and inclusion on their campuses. Indicators and measures are being developed
as part of a college-wide Diversity, Equity, and Inclusion Strategic Plan.
Institutional Capacity Building includes
equity commitment and capacity, engagement with external stakeholders,
professional development and training, and diverse faculty and staff. Indicators include regular meetings of
professional technical advisory groups and articulation agreements with are
high schools. Additional measures being considered are the ratio of students to
like-self faculty and equity-focused professional development and training for
all employees.
The shift from Core Themes to the
Strategic Framework should result in better alignment with key focus areas of OC’s
mission and goals. Since the development
of the Core Themes, reviewing the Mission Fulfillment Indicators has been the
purview of the Accreditation Leadership Team which includes cross-campus
representation, but the data has not been widely shared in a regular,
systematic manner. With the
establishment of the governance model outlined in Recommendation
1, the goal is to share data and assessment of the indicators with related
committees and councils to support systematic, college-wide assessment as part
of the broader planning cycle. Relevant
data will also be shared with stakeholders across the college as part of the strategic
planning assessment process.
The institution provides a
brief overview of the student achievement measures it uses as part of its
ongoing self-reflection, along with comparative data and information from at
least five institutions it uses in benchmarking its student achievement
efforts. In providing the overview, the institution may consider including
published indicators including (but not limited to) persistence, completion,
retention, and postgraduation success student achievement measures.
Additionally, the report must include the widely published indicators
disaggregated by race, ethnicity, age, gender, socioeconomic status, first
generation college student, Pell status, and any other institutionally
meaningful categories that may help promote student achievement and close
equity gaps, i.e., barriers to academic excellence and success amongst students
from underserved communities.
OC measures student achievement using
academic benchmarks
that students must meet to successfully complete degrees and certificates as
defined by the State Board
of Community and Technical Colleges Student Achievement Initiative. These targets represent meaningful milestones
of student success across all groups of students. These measures include:
· First year retention (first quarter and first year);
· First year progression (earning 15 then 30 college-level
credits);
· Completing college-level Math and English/Writing, and;
·
Completions (degrees, certificates).
Peer
institutions were selected based on the following factors: availability of
data, similar enrollments and demographics, geographic location, and Carnegie
Classification®. The Carnegie Classification® has been the leading framework
for recognizing and describing institutional diversity in U.S. higher education.
Three regional peers and two national peers were selected. Data for national
peers is limited to available Integrated Postsecondary Education Data System (IPEDS)
data. Standard measures for disaggregated student
populations that are in common use at the state level are used for comparison.
OC is working on developing more nuanced peer group comparisons for specific
student populations.
Regional Peers
Pierce College
District has a more metropolitan location but is the closest peer institution
in Washington state that also serves a large number of
military-affiliated students. Enrollments at each of the two campuses are similar to OC. Skagit Valley College has a similar enrollment
and similar geographic location of semi-rural with close proximity to a
metropolitan area (Everett). South Puget Sound (South PS) College has a similar
demographic mix of populations, similar enrollment, and similar geographic location
of semi-rural with close proximity to a metropolitan
area (Olympia).
National Peers
Holyoke Community
College in Holyoke, Massachusetts, has a Carnegie Classification® of Associate’s
Colleges: High Transfer-High Traditional. OC has High Transfer but is not High Traditional.
Holyoke’s population is 40,117, close to Bremerton at 37,729. The demographic
makeup of both the city and county are closer to Bremerton and Kitsap County
than other colleges with the same Carnegie Classification®.
Cayuga County
Community College in Auburn, New York has a Carnegie Classification® of Associate’s
Colleges: High Transfer-High Nontraditional, which is closer to OC than Holyoke
(High Transfer-High Traditional). Auburn’s population is 27,687, close to Bremerton
at 37,729, but the county population is 80,026, much smaller than Kitsap County
at 251,133. The demographics of Bremerton and Kitsap County are only slightly
more diverse than Cayuga’s. It is also a multi-campus school like OC.
Gender, Age, and Race
Data is by
headcount for Fall 2020.
Table 2. Gender
|
College
|
Female
|
Male
|
Not Reported
|
|
Olympic
|
55%
|
40%
|
5%
|
|
Pierce
|
62%
|
33%
|
5%
|
|
Skagit Valley
|
56%
|
44%
|
0%
|
|
South Puget
Sound
|
57%
|
37%
|
6%
|
Table 3. Age
|
College
|
<20
|
20-24
|
25-29
|
30-39
|
40<
|
|
Olympic
|
35%
|
22%
|
15%
|
17%
|
11%
|
|
Pierce
|
40%
|
24%
|
12%
|
14%
|
10%
|
|
Skagit Valley
|
34%
|
22%
|
14%
|
18%
|
12%
|
|
South Puget Sound
|
42%
|
20%
|
11%
|
15%
|
12%
|
Table 4. Race
|
College
|
Am. Indian
AK Native
|
Asian
|
Black
Afr. Am.
|
Hispanic
|
Pacific
Islander
|
White
|
2+ Races
|
Not Reported
|
|
Olympic
|
1%
|
7%
|
3%
|
4%
|
1%
|
62%
|
17%
|
5%
|
|
Pierce
|
1%
|
9%
|
8%
|
8%
|
2%
|
48%
|
21%
|
5%
|
|
Skagit Valley
|
1%
|
4%
|
2%
|
15%
|
1%
|
61%
|
15%
|
2%
|
|
South PS
|
2%
|
7%
|
3%
|
5%
|
1%
|
52%
|
18%
|
12%
|
Retention
Retention is for
first-time degree seeking students who entered college in Summer or Fall. National
comparisons are only available for full-time students for the entire college.
For system (in-state) peers, data with full-time and part-time students is
available. H U is an abbreviation for historically underserved students of
color, which is defined as any student with a reported census race code of
Black/African American, Native American (American Indian or Alaskan Native),
Hispanic, or Pacific Islander. LatinX refers to students with a reported census
ethnicity code of Hispanic or Latino/Latina. Tables 5-7 provide data on Fall-to-Fall
retention and Tables 8-10 provide data on first Fall-to-Winter retention.
Unless noted,
data is for Full-time and Part-time students with no national comparisons
available.
Retention, Fall-to-Fall
Table 5. Entire
College
Full-time Students
Only, national comparisons available
|
College
|
2015
|
2016
|
2017
|
2018
|
2019
|
|
Olympic
|
62%
|
62%
|
62%
|
64%
|
63%
|
|
Pierce
|
63%
|
63%
|
60%
|
61%
|
62%
|
|
Skagit Valley
|
60%
|
56%
|
59%
|
59%
|
54%
|
|
South Puget Sound
|
64%
|
65%
|
62%
|
65%
|
62%
|
|
Holyoke
|
52%
|
58%
|
59%
|
59%
|
57%
|
|
Cayuga County
|
59%
|
55%
|
54%
|
55%
|
N/A
|
Table 6. Historically
Underrepresented Students of Color
|
College
|
H U/Non-H U
|
2015
|
2016
|
2017
|
2018
|
2019
|
|
Olympic
|
H U
|
43%
|
50%
|
55%
|
54%
|
45%
|
|
Olympic
|
Non-H U
|
49%
|
58%
|
58%
|
54%
|
54%
|
|
Pierce
|
H U
|
50%
|
50%
|
49%
|
53%
|
47%
|
|
Pierce
|
Non-H U
|
58%
|
56%
|
57%
|
56%
|
58%
|
|
Skagit Valley
|
H U
|
48%
|
49%
|
54%
|
53%
|
50%
|
|
Skagit Valley
|
Non-H U
|
54%
|
53%
|
55%
|
55%
|
50%
|
|
South Puget Sound
|
H U
|
58%
|
57%
|
51%
|
49%
|
56%
|
|
South
Puget Sound
|
Non-H U
|
57%
|
61%
|
58%
|
59%
|
57%
|
Table 7. LatinX
Students
|
College
|
2015
|
2016
|
2017
|
2018
|
2019
|
|
Olympic
|
53%
|
58%
|
59%
|
62%
|
48%
|
|
Pierce
|
53%
|
62%
|
58%
|
60%
|
53%
|
|
Skagit Valley
|
58%
|
57%
|
59%
|
62%
|
56%
|
|
South Puget Sound
|
63%
|
63%
|
60%
|
58%
|
62%
|
Retention, 1st Fall-to-Winter
(First Quarter)
Table 8. All
Students
|
College
|
2015
|
2016
|
2017
|
2018
|
2019
|
|
Olympic
|
85%
|
82%
|
85%
|
84%
|
84%
|
|
Pierce
|
84%
|
85%
|
81%
|
83%
|
84%
|
|
Skagit Valley
|
80%
|
83%
|
85%
|
87%
|
82%
|
|
South Puget Sound
|
86%
|
85%
|
84%
|
84%
|
86%
|
Table 9.
Historically Underrepresented Students of Color
|
College
|
H U/Non-H
U
|
2015
|
2016
|
2017
|
2018
|
2019
|
|
Olympic
|
H U
|
79%
|
78%
|
84%
|
78%
|
79%
|
|
Olympic
|
Non-H U
|
86%
|
83%
|
86%
|
86%
|
86%
|
|
Pierce
|
H U
|
81%
|
80%
|
77%
|
81%
|
79%
|
|
Pierce
|
Non-H U
|
85%
|
86%
|
83%
|
83%
|
86%
|
|
Skagit
Valley
|
H U
|
74%
|
79%
|
81%
|
86%
|
81%
|
|
Skagit
Valley
|
Non-H U
|
82%
|
85%
|
86%
|
88%
|
82%
|
|
South
Puget Sound
|
H U
|
85%
|
83%
|
80%
|
80%
|
85%
|
|
South
Puget Sound
|
Non-H U
|
86%
|
85%
|
85%
|
84%
|
86%
|
Table 10. LatinX
Students
|
College
|
2015
|
2016
|
2017
|
2018
|
2019
|
|
Olympic
|
85%
|
82%
|
85%
|
84%
|
84%
|
|
Pierce
|
84%
|
85%
|
81%
|
83%
|
84%
|
|
Skagit Valley
|
80%
|
83%
|
85%
|
87%
|
82%
|
|
South Puget Sound
|
86%
|
85%
|
84%
|
84%
|
86%
|
Progression
Progression is for
first-time degree seeking students who started in Summer or Fall, both
full-time and part-time, who earn 15 credits (Tables 11-13) or 30 credits (Tables
14-16) within their first year. National
comparisons not available.
Progression, 15 credits within 1st year
Table 11. All
Students
|
College
|
2015
|
2016
|
2017
|
2018
|
2019
|
|
Olympic
|
55%
|
65%
|
70%
|
64%
|
65%
|
|
Pierce
|
71%
|
69%
|
68%
|
69%
|
65%
|
|
Skagit Valley
|
68%
|
72%
|
73%
|
75%
|
69%
|
|
South Puget Sound
|
75%
|
76%
|
73%
|
73%
|
72%
|
Table 12. Historically Underrepresented
Students of Color
|
College
|
H U/Non-H U
|
2015
|
2016
|
2017
|
2018
|
2019
|
|
Olympic
|
H U
|
50%
|
57%
|
67%
|
62%
|
57%
|
|
Olympic
|
Non-H U
|
56%
|
68%
|
70%
|
65%
|
67%
|
|
Pierce
|
H U
|
63%
|
62%
|
59%
|
65%
|
58%
|
|
Pierce
|
Non-H U
|
73%
|
70%
|
71%
|
71%
|
69%
|
|
Skagit Valley
|
H U
|
60%
|
67%
|
66%
|
70%
|
63%
|
|
Skagit Valley
|
Non-H U
|
70%
|
74%
|
75%
|
76%
|
71%
|
|
South Puget Sound
|
H U
|
73%
|
72%
|
68%
|
67%
|
70%
|
|
South Puget Sound
|
Non-H U
|
75%
|
77%
|
75%
|
75%
|
73%
|
Table 13. LatinX
Students
|
College
|
2015
|
2016
|
2017
|
2018
|
2019
|
|
Olympic
|
50%
|
65%
|
70%
|
67%
|
59%
|
|
Pierce
|
63%
|
67%
|
60%
|
65%
|
59%
|
|
Skagit Valley
|
62%
|
70%
|
65%
|
70%
|
63%
|
|
South Puget Sound
|
78%
|
72%
|
72%
|
66%
|
77%
|
Progression, 30 credits within 1st
year
Table 14. All
Students
|
College
|
2015
|
2016
|
2017
|
2018
|
2019
|
|
Olympic
|
37%
|
44%
|
49%
|
44%
|
46%
|
|
Pierce
|
40%
|
38%
|
38%
|
38%
|
51%
|
|
Skagit Valley
|
42%
|
48%
|
52%
|
52%
|
45%
|
|
South Puget Sound
|
52%
|
57%
|
50%
|
53%
|
51%
|
Table 15.
Historically Underrepresented Students of Color
|
College
|
H U/Non-H
U
|
2015
|
2016
|
2017
|
2018
|
2019
|
|
Olympic
|
H U
|
31%
|
36%
|
43%
|
39%
|
35%
|
|
Olympic
|
Non-H U
|
39%
|
46%
|
50%
|
46%
|
49%
|
|
Pierce
|
H U
|
35%
|
32%
|
32%
|
34%
|
43%
|
|
Pierce
|
Non-H U
|
40%
|
39%
|
40%
|
40%
|
56%
|
|
Skagit
Valley
|
H U
|
29%
|
39%
|
42%
|
46%
|
42%
|
|
Skagit
Valley
|
Non-H U
|
46%
|
50%
|
55%
|
55%
|
47%
|
|
South
Puget Sound
|
H U
|
49%
|
55%
|
44%
|
47%
|
46%
|
|
South Puget Sound
|
Non-H
U
|
53%
|
58%
|
51%
|
55%
|
53%
|
Table 16. LatinX
Students
|
College
|
2015
|
2016
|
2017
|
2018
|
2019
|
|
Olympic
|
32%
|
41%
|
46%
|
40%
|
36%
|
|
Pierce
|
32%
|
37%
|
30%
|
34%
|
44%
|
|
Skagit Valley
|
27%
|
41%
|
43%
|
47%
|
42%
|
|
South Puget Sound
|
51%
|
57%
|
47%
|
44%
|
49%
|
College-Level English and Math
Cohort is
first-time degree seeking (transfer or professional/technical) students who
entered in either summer or fall quarters and completed at least one
college-level English (Tables 17-19) or Math (Tables 20-22) course in their
first year. Includes Full-time and Part-time Students, national comparisons not
available.
College-Level English
Table 17. All
Students
|
College
|
2015
|
2016
|
2017
|
2018
|
2019
|
|
Olympic
|
45%
|
54%
|
52%
|
47%
|
51%
|
|
Pierce
|
66%
|
64%
|
58%
|
58%
|
57%
|
|
Skagit Valley
|
53%
|
58%
|
56%
|
54%
|
54%
|
|
South Puget Sound
|
56%
|
59%
|
57%
|
60%
|
58%
|
Table 18.
Historically Underrepresented Students of Color
|
College
|
H U/Non-H
U
|
2015
|
2016
|
2017
|
2018
|
2019
|
|
Olympic
|
H U
|
40%
|
48%
|
44%
|
39%
|
44%
|
|
Olympic
|
Non-H U
|
47%
|
56%
|
54%
|
50%
|
53%
|
|
Pierce
|
H U
|
60%
|
56%
|
51%
|
52%
|
53%
|
|
Pierce
|
Non-H U
|
67%
|
65%
|
61%
|
62%
|
61%
|
|
Skagit
Valley
|
H U
|
46%
|
54%
|
53%
|
52%
|
53%
|
|
Skagit
Valley
|
Non-H U
|
55%
|
60%
|
57%
|
55%
|
54%
|
|
South
Puget Sound
|
H U
|
52%
|
54%
|
53%
|
59%
|
58%
|
|
South Puget Sound
|
Non-H U
|
57%
|
62%
|
59%
|
61%
|
58%
|
Table 19. LatinX
Students
|
College
|
2015
|
2016
|
2017
|
2018
|
2019
|
|
Olympic
|
39%
|
54%
|
48%
|
41%
|
46%
|
|
Pierce
|
61%
|
63%
|
56%
|
53%
|
53%
|
|
Skagit Valley
|
51%
|
56%
|
55%
|
56%
|
52%
|
|
South Puget Sound
|
54%
|
54%
|
56%
|
59%
|
61%
|
College Level Math
Table 20. All
Students
|
College
|
2015
|
2016
|
2017
|
2018
|
2019
|
|
Olympic
|
26%
|
29%
|
31%
|
28%
|
32%
|
|
Pierce
|
40%
|
39%
|
38%
|
37%
|
38%
|
|
Skagit Valley
|
26%
|
30%
|
32%
|
27%
|
30%
|
|
South Puget Sound
|
34%
|
32%
|
28%
|
40%
|
41%
|
Table 21.
Historically Underrepresented Students of Color
|
College
|
H U/Non-H U
|
2015
|
2016
|
2017
|
2018
|
2019
|
|
Olympic
|
H U
|
23%
|
23%
|
26%
|
23%
|
25%
|
|
Olympic
|
Non-H
U
|
27%
|
30%
|
32%
|
30%
|
34%
|
|
Pierce
|
H U
|
32%
|
33%
|
28%
|
31%
|
32%
|
|
Pierce
|
Non-H
U
|
44%
|
41%
|
42%
|
40%
|
42%
|
|
Skagit
Valley
|
H U
|
21%
|
24%
|
28%
|
22%
|
26%
|
|
Skagit
Valley
|
Non-H
U
|
28%
|
31%
|
34%
|
30%
|
31%
|
|
South Puget Sound
|
H U
|
30%
|
28%
|
21%
|
35%
|
37%
|
|
South Puget Sound
|
Non-H U
|
36%
|
34%
|
31%
|
42%
|
43%
|
Table 22. LatinX
Students
|
College
|
2015
|
2016
|
2017
|
2018
|
2019
|
|
Olympic
|
28%
|
27%
|
28%
|
25%
|
25%
|
|
Pierce
|
31%
|
35%
|
32%
|
32%
|
34%
|
|
Skagit Valley
|
20%
|
25%
|
29%
|
23%
|
27%
|
|
South Puget Sound
|
32%
|
30%
|
22%
|
36%
|
37%
|
Completions
Completion is for first-time
full-time degree seeking students who completed in 2017, within three years of
entering or 150% time.
Table 23.
Completions by Y3, 2017
|
College
|
Entire College
|
LatinX
|
H U
|
Non-H U
|
|
Olympic
|
33%
|
27%
|
23%
|
30%
|
|
Pierce
|
33%
|
27%
|
21%
|
29%
|
|
Skagit Valley
|
38%
|
29%
|
24%
|
33%
|
|
South Puget
Sound
|
35%
|
35%
|
25%
|
29%
|
Data Analysis
OC is performing at
a similar level to its peers for first year retention of full-time students. It
appeared that the gap was closing in first year retention for historically
underrepresented students of color in aggregate and LatinX specifically, both full-time
and part-time, but the gap returned in 2019. The gaps between historically
underrepresented students of color and their peers remain persistent. LatinX
students appear to do slightly better than their historically underrepresented
students of color in aggregate, but gaps remain. First quarter retention of all
students is at a similar level to peers. OC is still in its infancy in terms of
completing the Guided Pathways work around three of the four pillars: simplifying
the path; helping students stay on the path; ensuring students are learning. OC
began Guided Pathways work in 2019 with the creation and delineation of
pathways and is still working on rolling those out to students as part of the
outreach, intake, and advising processes. Guided Pathways work is a main focus of the 2021-2022 and 2022-2023 academic years. The
three in-state peers were all early adopters of Guided Pathways, and
consequently show improvements in attainment of the 15 and 30 credit milestones
during the first year. All colleges in the State Board of Community and
Technical Colleges (SBCTC) system struggle with persistent equity gaps. It is
also important to note that all SBCTC colleges suffered large drops in
enrollment from historically underserved populations during the COVID pandemic.
This is reflected in the data that is coming in now for 2020 and will make it
more challenging to interpret outcomes for the next few years.
The institution must provide programmatic assessment of
at least two programs as evidence of a continuous process of improvement. The
programs should be broadly representative of institutional efforts.
Three programs
were selected as a broad representation of ongoing assessment work in various
areas of the college including non-instructional and instructional programs. Advising
Services represents a non-instructional program in Student Services and is in
the process of a significant restructuring in response to assessment data and Guided
Pathways research. Digital Filmmaking (BAS-DF) is the newest of four
baccalaureate programs at OC, but its enrollment and cohort approach is
consistent with the other baccalaureate programs. Faculty have consistently used
data and analysis to inform improvements and restructuring. Early Childhood Education
(ECED) provides an example of certificate and Applied Associates of Science – Transfer
(AAS-T) programs. ECED also serves as an example of an emphasis area discipline
for the Associate of Arts – Direct Transfer Agreement (AA-DTA). ECED has
undergone significant restructuring of their degrees as a
result of recent alignment with state modifications to Early Childhood
Education expectations. These are not exhaustive representations of these
assessment efforts, but they demonstrate different levels of institutional and
programmatic assessment.
Advising
Services contributes to OC's mission, vision, and values by providing
personalized support for students in achieving their goals. The primary outcomes for advising are to
ensure that:
·
Students are connected with
advising support that is timely, consistent, and aligned with their educational
pathway.
·
Students will have timely access to the support
services they need to accomplish their educational and career goals.
Assessment of Key Outcomes
To determine if
the program is achieving these outcomes, multiple approaches are used to
collect data and student feedback to identify areas of improvement. Services are formally evaluated typically
every two years via the Community College Survey of Student Engagement (CCSSE)
and Survey of Entering Student Engagement (SENSE).
Students who
meet with an advisor are more engaged across all CCSSE benchmarks than those
who haven’t. Section 12 of the CCSSEE 2018 survey
includes questions on use of services, satisfaction
and importance. Tables 24-26 include advising specific responses for OC.
Table 24. 12.1a. How
often have you used the academic advising/planning during the current academic
year?
|
Responses
|
OC
|
Medium
Colleges
|
2018
Cohort
|
|
Never
|
28.2%
|
19.3%
|
19%
|
|
1
time
|
25.6%
|
25.5%
|
25.9%
|
|
2-4
times
|
38.5%
|
43.6%
|
43.3%
|
|
5
or more times
|
7.7%
|
11.6%
|
11.8%
|
Table
25. 12.2a. How satisfied are you with academic advising/planning?
|
Responses
|
OC
|
Medium
Colleges
|
2018
Cohort
|
|
Not
at all
|
9.8%
|
6.7%
|
7.1%
|
|
Somewhat
|
32%
|
38.1%
|
38.5%
|
|
Very
|
33.3%
|
37.1%
|
36.5%
|
|
N/A
|
24.8%
|
18.1%
|
17.8%
|
Table 26. 12.3a
How important is academic advising/planning to you at this college?
|
Responses
|
OC
|
Medium
Colleges
|
2018
Cohort
|
|
Not
at all
|
16.4%
|
8.9%
|
8.7%
|
|
Somewhat
|
27.6%
|
24.3%
|
24.9%
|
|
Very
|
55.9%
|
66.8%
|
67.3%
|
For the SENSE survey, academic goal setting
and planning was the focus of analysis to determine if all entering students,
both full-time and part-time, are starting right. Section 18 of the SENSE survey focuses on
academic planning during the first three weeks of the
quarter with specific questions on advising.
· 18e. An advisor helped me to select a course
of study, program, or major
· 18f. An advisor helped me to set academic goals and to create a plan for
achieving them
· 18g. An advisor helped me to identify the courses I needed to take during my
quarter
Table 27.
Responses from Full-time and Part-time Students
|
Response
|
18 e.
Full-time
|
18e.
Part-time
|
18 f.
Full-time
|
18 f.
Part-time
|
18 g.
Full-time
|
18 g.
Part-time
|
|
Strongly Agree
|
31.4%
|
25.9%
|
24.2%
|
17.9%
|
33.2%
|
28.6%
|
|
Agree
|
36.4%
|
30.4%
|
27.7%
|
26.8%
|
43.5%
|
41.1%
|
|
Neutral
|
19.2%
|
20.5%
|
25.8%
|
19.6%
|
13.4%
|
9.8%
|
|
Disagree
|
6.1%
|
6.3%
|
15.0%
|
13.4%
|
5.7%
|
3.6%
|
|
Strongly Disagree
|
6.9%
|
17.0%
|
7.3%
|
22.3%
|
4.2%
|
17.0%
|
As
OC began implementing Guided Pathways, research on the model was also
reviewed. One example is Show
Me the Way: The Power of Advising in Community Colleges,
a 2018 national report from the Center for Community College Student Engagement.
The report highlights how the transition to Guided Pathways requires advising
to re-evaluate and update models to improve student outcomes. Using national SENSE and CCSSEE data, the
report also notes the need for an advising process that is intrusive,
equitable, and holistic.
Since OC started
transitioning to a Student Success Coaching model, data from the student
scheduling portal, Who’s Next, is also
being analyzed to determine the length of time from request to
appointment, identify which programs have the highest demand to assess coach
caseload availability, and where to allocate resources and need for adding
additional coaches.
Analysis of Results
Student feedback from the 2017 SENSE and 2018 CCSSEE
reports, Guided Pathways research, and staff and faculty feedback, revealed
several concerns about the prior advising model:
1.
Issues with advising processes including number
of steps in new student onboarding, lack of drop-in hours for immediate help,
and long wait times.
2.
Lack of assigned advisors that resulted in
students not feeling connected and not knowing who specifically to turn to for
academic support. There was also a lack of continuity and consistency of
ongoing communication and follow up. While true for all students, this was
particularly notable for part-time students.
3.
Lack of alignment and collaboration with other
student services and registration departments led to inconsistent messaging of
processes and requirements, with students being sent back and forth to multiple
offices, often receiving conflicting information.
4.
Lack of clear identification of, and transition
to, program Faculty Advisors resulted in many students not connecting to their
Faculty Advisors.
5.
Lack of consistent meetings within the department,
across departments, and between campuses resulted in decreased collaboration.
Implementation of changes
In Fall 2020, the Advising Center began the
transition to a Student Success Coaching caseload model in alignment with the
Guided Pathways initiative that seeks to streamline a student’s journey through
college by providing structured choice, revamped support, and clear learning
outcomes. This model will
establish proactive and holistic student
engagement that is a leading factor in student satisfaction and retention. Streamlining
the steps and process for students will help to eliminate the “run-around” that
can lead to confusion and dissatisfaction. The new model aims to provide
year-round, proactive, engaging, and welcoming experiences for students from
admission through completion, with well-defined processes for students to identify
resources and transition to faculty advisors. In the new
model, new student advising for all degree-seeking students will be mandatory.
Each quarter, coaches will encourage continuing students on their caseload to
meet with their coach or faculty advisor for educational planning. As a result, all degree seeking students will
experience advising and fewer students will fall through the cracks without
services.
Student success coaches work with new and
continuing undecided students to explore pathway options, expectations, and
requirements, and serve as bridges to support services. Student success coaches
engage with students to promote learning and academic excellence, and guide
students on their educational journey from admission to completion to create a
better experience for students from registration to completion and across
campus.
The following describes changes implemented
in relation to concerns identified through the advising assessment process.
1.
Issues with advising processes including
number of steps in new student onboarding, lack of drop-in hours for immediate
help, and long wait times.
Staffing is being expanded and reconfigured across the
Advising Center since 2020. There are currently six new positions: a full-time
exempt student success coach manager and five full-time exempt student success
coaches. These exempt positions increase advising availability to students
year-round. Further increased staffing of student success coaches will enable
us to offer in person and virtual drop-in hours in the future.
The Advising Center
now dedicates an assigned Coach-of-the-Day to respond to general Advising
Center emails and voicemails. Emails and voicemails are now answered same or
next day, dramatically reducing response times.
The Coach-of-the-Day will be in the Student Services Virtual Lobby when
available.
Two new scheduling tools have been implemented to
increase the ease and efficiency for students to make appointments. The
Advising Appointment Request Form, available on the Advising Center website,
provides intake information that enables the scheduling staff to connect
students to the appropriate coach in their pathway, or route undecided students
to the first available coach. Calendly licenses have been purchased so that
students can book with a coach directly. Currently, coaches give their Calendly
link to students on their caseload only. As coaching capacity is increased to
fully cover each program and pathway, direct booking through Calendly will be
made available on the Advising website. Appointment reminders are sent either
automatically (Calendly) or manually by front desk staff to minimize missed
appointments.
To improve the student enrollment experience and reduce the
number of steps in new student onboarding, the Student Success Coaches are
cross trained to answer basic registration and basic financial aid questions
and execute many of the registration processes. Coaches are now able to do
transcript reviews, and based on the review, can assign permission codes,
course overrides, and enroll students for their first quarter classes.
2.
Lack
of assigned advisors that resulted in students not feeling connected and not
knowing who specifically to turn to for academic support. There was also a lack
of continuity and consistency of ongoing communication and follow up.
Student success coaches are accountable to their assigned students and
offer follow-through so that no student falls through the cracks. Students are assigned to a coach based on
their pathway for their entire time at OC. This coach knows the student’s history,
eliminating the need for the student to start over at each appointment.
Advising Notes in the electronic student records in the statewide enterprise
and student management system (ctcLink) furthers this holistic support by
enabling student success coaches, faculty, and staff to communicate with each
other about a student. Students are contacted by both phone and email each
quarter by student success coaches and advising staff and encouraged to
schedule an appointment to discuss course planning, campus resources, programs
of study, etc. This outreach will be assessed to determine a) the
percentage of students who meet with an advisor after being contacted; b)
whether those students who meet with an advisor are retained at a higher rate
than those who did not; and c) whether there is an increase in satisfaction of
advising.
3.
Lack of
alignment and collaboration with other student services and registration
departments led to inconsistent messaging of processes and requirements, with
students being sent back and forth to multiple offices, often receiving
conflicting information.
The aim of the Student Success Coaching model is to streamline the steps
and processes for students and eliminate the “run-around” that can lead to
confusion and dissatisfaction. Since Fall 2020, the Student Success Coaching
model is decreasing registration steps for all students. Student success coaches
are cross-trained in registration and basic financial aid which provides a
“one-stop-shop” model that reduces the number of offices a student needs to
visit. Student success coaches meet
weekly as a group, as well as with the larger student services division, to
stay connected and ensure that consistent information is provided to students.
4.
Lack of
consistent departmental, cross-departmental, and cross-campuses meetings
resulted in decreased collaboration within and across campuses, operating in a
more siloed capacity.
The Advising Center has reestablished weekly
meetings with the student success coaches and departmental coaches across the
college where
representatives from multiple areas will be invited to share information and
address questions. Since student success coaches will be aligned with
individual Guided Pathways clusters, they will work closely with each
department within that pathway and collaborate across divisions. Student
success coaches will work with instructional faculty to develop current,
accurate, and consistent program information for students.
5.
Lack of
clear identification and transition to program Faculty Advisors resulted in
many students not connecting to Faculty Advisors.
The Advising
Center will be implementing a “Declared and Prepared” model of transitioning
students to faculty advisors. Once a student is “Declared and Prepared” (they
have declared their program and are prepared to take classes within the
program), student success coaches will provide an intentional transition to the
faculty advisor, who provides specialized knowledge of that program, career,
and transfer options. By making the bridge to faculty advising explicit,
student success coaches will
assist OC in realizing its goal of helping all students identify a plan early
in their studies and connect with the best resources available for helping them
achieve it.
The CSSEE and SENSE surveys
have not been collected since 2018 due to COVID-19, but feedback so far has
shown that the new Student Success Coaching model is proving beneficial.
Examples of feedback from staff, faculty and students
since implementing the Student Success Coach model:
“I wanted … to express my appreciation to you, because a couple of my team
members have mentioned that you have been instrumental in helping them to
graduate, get their schedules in order, and taken the time to really listen to
them. This has set them up for success, not only in college, but outside of it
too….” (Staff)
“Thank you for going above and beyond for me! I am very grateful that so
many people took an interest to make sure I was on the right path. I am now
confident that I am now enrolled in the right classes to finish my degree.”
(Student)
“Wow! This is super helpful.
Thank you for taking such good care of this student’s needs.” (Faculty)
Lessons Learned
Ongoing and
systematic collection and analysis of data and student feedback is essential to
identify ways to refine and strengthen support for students. Positive results of these changes should
include increased student satisfaction and frequency of use in the CCSSEE
survey results and a decrease in the gaps between full-time and part-time
students in the SENSE survey results. The
Advising Center will be engaging with college stakeholders over the next year
in establishing frameworks and benchmarks and designing an assessment plan to
collect and analyze data to improve student learning, student development, and
operational effectiveness. A
comprehensive self-study will be undertaken to identify program improvements to
be implemented by the end of the current three-year assessment cycle. OC’s
strategic planning process will also provide opportunities for assessment of
department level goals.
OC’s Baccalaureate in Applied
Science (BAS) in Digital Filmmaking was approved in 2016-17 and the first
cohort started in the fall of 2017. Designed as a two-year upper-division
program that allows students to complete an Applied Science bachelor’s degree
in Filmmaking, this program differs from others in the state and many in the
nation in that the focus is not on Film Studies, but instead on the art and
science of making films.
The BAS-DF is a practitioner-oriented, applied degree that
prepares students for a range of positions in the rapidly changing field of
digital film, including jobs in video production, directing, cinematography, screenwriting,
and acting. The degree also prepares them for digital content production in a
variety of industries, including jobs with branding, marketing, and advertising
companies, businesses in any industry that creates digital content for training
purposes, and entrepreneurial opportunities. While the degree stands apart from
others by enabling students to learn a broad range of creative and technical
skills in all film subjects, students may focus on an area of study for the
senior thesis project to deepen skills in a specific role.
The BAS-DF program developed six program outcomes to guide and
assess student success. The BAS DF program adds knowledge, skills, and
abilities in filmmaking expertise to students' professional technical education
and work experience. Upon successful completion of the program, all students
will be able to:
1.
Consciously develop a responsible,
socially, culturally, and historically relevant aesthetic and apply it to
filmmaking disciplines (such as producing, directing, acting, scriptwriting,
editing, cinematography, and post-production).
2.
Demonstrate competency as a practitioner
in a range of filmmaking disciplines.
3.
Assess productions for quality control,
ethical compliance, and sound business practices.
4.
Demonstrate leadership, project
management, and effective collaboration on filmmaking teams.
5.
Evaluate emerging technologies in
filmmaking and industry trends to maintain currency and drive innovation.
6.
Integrate specialization in two or more
filmmaking disciplines in an advanced film project.
Assessment of Key Outcomes
The
program has multiple approaches for assessing success in meeting these
outcomes. Individual courses are reviewed – using student evaluations, student
success on course assignments aligned to the course outcomes (including those
that align to the program outcomes), and the use of a collective review and
assessment of the capstone products developed in the program. The portfolio of
films and specific work on films produced during the program are reviewed,
assessed through a capstone rubric, and used to evaluate students for further
instruction as well as to evaluate the success of the program. Individually,
students are also asked to do a self-evaluation of their progress, using their
initial entry portfolios as a baseline, and to compare their growth in content
knowledge and skills over the course of the entire program – with the capstone
product again providing a useful culminating measurement of growth throughout
the program. Using these combined elements, the faculty have generated data
that not only measures the success of the program in meeting the program
outcomes, but it has also used the resulting information generated to further
refine and improve the program.
Analysis of Results
To
assess learning and student success in the BAS-DF program, the faculty utilize
student evaluations from each class in the program, evaluate student success in
meeting course outcomes, are increasing use of Canvas tools to align student
learning activities to course learning outcomes, and evaluate the results of
this data. They additionally have aligned the student learning outcomes in each
course to the program outcomes and use these in their weekly staff meetings to
identify trends that inform potential actions for improvement. The program
began in Fall 2017 and the typical revisions have included the sequencing of
the courses in the program, redesigning some courses to maximize student
success, and examining how the Associate program successfully feeds into the
BAS-DF program. This latter component has been particularly important as the
faculty designed their first Articulation Agreement for students from other
institutions to transition into OC’s BAS-DF successfully.
Other
informal factors that are used by the faculty and students includes Portfolios,
student forums and input from specialists in the field including the Advisory
Council for DF. The Portfolio required of students entering the program is used
to track improvement of individuals (self-evaluations) and aggregate
improvement over the course of the cohort program. Faculty also coordinate
student forums annually, and sometimes quarterly, to solicit feedback from
students within and across cohorts. This not only helps aid in communication
between students and faculty but provides further informal input in the success
and challenges of the program. An example of informal feedback informing action
includes the recent decision to add a Documentary Filmmaking certificate to the
program. Cold calls from people in the region, input from current faculty with
specialization in the area, input from the Advisor Council, and requests of
students confirmed an increasing demand for this addition to a largely
narrative film program. Research using Economic Modeling Specialists,
International (EMSI) and regional articles on the growing call for skills in
filmmaking for Public Service Announcements, corporate videos, and
informational videos confirmed the demand for this specialized certificate. The
certificate has been approved for inclusion at the college level and OC is
currently seeking approval for this certificate from the state.
Implementation of Changes
Three
examples were selected to highlight the assessment process in the program
including course sequencing and course redesign to improve student outcomes.
A.
Course Sequencing
Student Evaluations and course outcomes
were used to evaluate program outcomes. A small but consistent percentage of
students revealed struggling with specific areas in courses. In later courses
students suggested having specific information sooner in the curriculum; Faculty
saw alignment between student success rates with specific outcomes that aligned
with student evaluation comments.
Faculty restructured sequencing of
Advanced Directing, Producing & Master Storytelling courses to address
sequential skill acquisition, and reinforcement of knowledge and skills. Master
Storytelling was placed in the first year, followed by the other two
classes.
Student performance on learning outcomes
for affected courses improved; student evaluations confirmed benefits of
sequence changes to reinforce learning. Program learning outcomes 2 and 4 are evaluated
across a variety of courses. Students are required to complete courses that
introduce and reinforce a breadth of skills. Evidence from portfolios and final
projects demonstrates a range of skills achieved across the filmmaking
disciplines. Feedback from student evaluations and in student forums confirmed
that the revisions in course sequencing assisted students in their preparation
for higher levels of achievement and success in courses that were shifted to
the second year of instruction. Program learning outcome 6 builds upon outcomes
2 and 4 and is evaluated through the final film project. The data demonstrates
that all students have achieved this program learning outcome, even though some
students were unable to complete all requirements for the program. Additional
evidence of success can be found through the number of student final projects
that have been submitted for screening at regional, national
and even international film festivals, with several students placing in the
semi-finalists, finalists, and winning the competitions.
B.
Course Redesign – Production Workshop
Faculty used the student evaluations,
student performance on course learning outcomes, and evidence of student
performance on program outcomes from the first cohort of BAS-DF students. They
identified trends in student performance and concerns related to the Production
Workshop course – namely the workload challenges - and aligned those to SLO
results. The ability for students to significantly improve and build upon prior
skills was limited due to the lack of sufficient time to reinforce and master
the plethora of skills targeted for the course.
Faculty in the BAS-DF decided to divide
the student learning outcomes and learning activities within Production
Workshop into two courses – PW I and PW II. By reducing the expectations for
the students to review, reinforce and master for a single class, and providing
two separate classes in two sequential quarters, the goal was to give students
time and space to address skills that needed additional work, reinforce those
skills, and build upon them in the following PW II quarter.
Based on the student performance and products (films, sections
of films, team projects), the division of the Production Workshop into two
classes improved the opportunity for students to identify weak areas, review
and reinforce their skills in those areas, and time to master specific skills.
The increased number of students with films receiving local, regional, national and international awards supports the assessment of
the program products in line with the program outcomes.
C.
Course Redesign – Master Storytelling
Based on review of student
learning outcomes and student work, as well as feedback from student
evaluations, the faculty identified that students perceived significant
repetition in the BAS level course from the Associate’s level Screenwriting courses.
This perception of redundancy was also apparent in the average level of
improvement on the part of students in the Master Storytelling course.
To ensure students new to the OC Film
school had the necessary preparation, the Film faculty reviewed all course and
program outcomes, identifying requirements necessary to be met by incoming
students to OC’s BAS-DF or course(s) necessary to take to meet those
requirements. To ensure students were challenged to meet the higher
BAS-DF Master Storytelling standards, a workshop component was added to the
class, with new materials covered at the start of class and the second half of
class workshopped student work.
The identification of “pre-requisite”
skills and learning to succeed in the BAS-DF program assisted the faculty in
developing a framework for designing Articulation agreements with other Community
and Technical Colleges. The addition of a workshop component to the
Master Storytelling class challenged students to critically examine their own
and peer work and accelerated the learning process. Student evaluations and
student work demonstrate the success in this course revision.
The faculty use of
qualitative, quantitative, formal and informal
assessment to gather information about the courses and program sequencing has
helped guide revisions to the program. The open communications and
modifications also resulted in excellent retention of students within each
cohort. The following data reveals the enrollment per cohort and the Fall-to-Fall
retention rates for each cohort. The analysis indicates a remarkably high
retention of students in the program. Recruitment for 2021/22 is still underway
so the numbers are not final.
Table 28. BAS-DF Cohort
Enrollment (annual)
|
Cohort /
Year
|
2017-18
|
2018-19
|
2019-20
|
2020-21
|
2021-22
|
|
Cohort (a)
|
17
|
18
|
18
|
20
|
12
|
|
Cohort (b)
|
N/A
|
16
|
18
|
18
|
20
|
|
Total Enrolled
|
17
|
34
|
36
|
38
|
32
|
|
Retention rate (1st
to 2nd year)
|
N/A
|
94%
|
100%
|
100%
|
100%
|
Similar to the retention rates, the
consistent focus on open lines of communication, listening to student input,
and modifying courses, sequences, and program requirements to address student
concerns has resulted in outstanding completion rates for the program. The
analysis of student completion (graduating from the BAS-DF program) indicates
consistent student success in the program. The numbers of students retained
from fall-to-fall in each cohort slightly differs from the completion rate, as
some students completed the coursework but did not achieve the level of GPA
required for the program or did not complete the state required Math
distribution credit that is required for the awarding of a bachelor (applied)
degree in the State of Washington.
Table 29. BAS-DF Cohort
Completion (by two-year cohorts)
|
Year
|
2017-19
|
2018-20
|
2019-21
|
|
Enrolled
|
17
|
18
|
18
|
|
Completed
|
16
|
18
|
17
|
Lessons Learned
The
program has set up a systematic process for reviewing work that helps inform
the assessment of course and program outcomes. These processes include the
incorporation of student evaluations, student success with course SLOs, student
self-evaluations, and student forums. Faculty also review formal and informal data
during regular meetings. Increased usage of the Canvas system for gathering
data will improve the incorporation of quantitative data and will provide
opportunities to disaggregate data to assess equity gaps for specific learning
outcomes. Additionally, as the program matures, it will be important to build systematic
processes for gathering quantitative and qualitative data that will continue to
inform the assessment and review of the program outcomes.
The
Early Childhood Education program (ECED) is long-standing at OC and is
comprised of various degrees and certificates. In the last three years, OC’s
ECED program has worked very closely with the State in reviewing degree
outcomes and course offerings, as well as the development of stackable
certificates that help guide students toward degree completion. Part of this
effort has included close collaboration with the Early Childhood Education
program at Western Washington University and created a seamless pathway for
students from initial certificates to an Associate degree, to a bachelor’s
degree. Upon completion of the two-year associate degrees at OC,
students should be able to work in programs involving young children, from Head
Start, childcare, parent cooperatives, private preschools and other child care facilities. The OC Education Program is based on
the Washington State Department of Children, Youth, and Families
Core Competencies.
Upon
successful completion of the AAS-T and ATA program, students will be able to:
1.
Acquire, interpret, and use information
and resources that support industry defined appropriate practice;
2.
Work as a team member and demonstrate
respect for diversity in an early childhood environment to accomplish family,
child and program goals;
3.
Demonstrate professional and personal
accountability in decision making and practices relative to children, families,
colleagues, and the community;
4.
Effectively communicate orally and in
writing in the context of early childhood settings;
5.
Design, maintain, document, and evaluate
early childhood environments and programming on a regular basis.
Assessment of Key Outcomes
The
ECED program faculty have taken into consideration overall program outcomes
along with state licensing requirements, which graduates of the program need to
meet, and national standards in the field.
Specifically, ECED faculty chose to focus the past few years on SLOs
that included components of cultural responsiveness to parallel the National
Association of the Education of Young Children (NAEYC) Advancing Equity in Early Childhood Education Position Statement
that aligned with OC’s priority focus on equity and inclusion.
Analysis of Results
Based
on the state and college priorities of equity and cultural responsiveness, the
faculty identified SLOs and courses, then infused these priorities not only in any
new ECED course that meets OC's Diversity and Social Justice (DSJ) requirements
within the program, but also assessed student awareness and mastery of
culturally responsive teaching across the curriculum. This includes review of student lesson plans,
execution of lesson plans including video recording and critique, written plans
that meet the culture of families served and reflection of personal biases that
impact direct work with children and families.
Faculty also observe students in all levels of practicum to be certain
that culturally responsive teaching practices are followed.
Implementation of Changes
The
program focus for the past and upcoming year is to identify specific key
assessments in the ECED State Stackable certificates so that faculty can work
together to assess all students. This also allows specific assignments to be
developed in one course, then revised and mastered in supportive courses. Examples
include observation requirements and lesson plan work that increases in
expectations over the course of a series of classes. As specific assignments
are identified and aligned with SLOs, tracking of student completion and
success of key assessments will be included in advising notes for each
student. Key assessments will be aligned
with NAEYC professional preparation standards in order to
prepare for future accreditation efforts.
The ECED Key Assessment Alignment chart (Appendix B)
indicates the progress thus far is and will be completed this academic year
once ECED adjunct faculty are able to be included in the discussion.
Lessons Learned
The ECED program has learned a number of lessons over the course of the assessment work
of the past few years. The changes in curriculum and improvements in advisement
and pathways work created a need to vary the annual schedule of ECED courses.
Some classes were moved to other quarters, some were adjusted by offering
online offerings one quarter and face-to-face another quarter, as well as day
and evening offerings. The program staff will continue to review and adjust the
annual schedule as needed.
Specific course assignments
are now being aligned with student learning outcomes for the courses. For
example, if students are asked to complete an observation of a child, then this
assignment is tied to a specific student learning outcome that addresses
observation. An example includes the EDUC& 121 Child Development class that
requires students to observe infants, toddlers and
preschoolers. The specific assignment instructions align the activity to NAEYC Standard
One: Promoting Child Development and Learning:
·
1a: Knowing and understanding young
children’s characteristics and needs;
·
1b: Knowing and understanding the
multiple influences on development and learning; and
·
1c: Using developmental knowledge to
create healthy, respectful, supportive, and challenging learning environments).
The students are given
directions for their observation assignment and asked to write a comparison and
contrast paper that explains development patterns of growth for typically
developing children based on their observations and knowledge.
Finally, the work with the
state and Western Washington University (WWU) on curriculum alignment created a
practice of meeting quarterly that has strengthened communications between the
two institutions. The quarterly meetings have also resulted in changes that
include moving the ECED Children’s Literature class from an ECED designated
course to an ENGL (English) Children’s Literature Humanities course offering.
Another adjustment was to start a class, ECED 220 History and Theory of Early
Childhood, that builds on the theoretical foundation of early learning and
bridges nicely into WWU’s course offerings. ECED 220 is being offered for the
first time this summer. The benefits from the improved communications, shared
curricular development, and more fluid pathways for Olympic College students to
matriculate to WWU have helped systematize collaboration and alignment of work
that will continue over the years.
The
institution must provide its reflections on any additional efforts or
initiatives it plans on undertaking as it prepares for the Year Seven
Evaluation of Institutional Effectiveness Report.
OC is starting
a new Strategic Planning cycle and initiating a Governance system in Fall 2021. Both efforts will improve
transparency and college-wide involvement of all constituencies while also
aligning and integrating institutional planning and the allocation of resources
for achieving goals. College Governance
fosters a culture of collaboration, engagement, and collective investment in the
mutual goals of fulfilling OC’s vision, mission, values, student success, and
institutional effectiveness. The Governance System clearly defines and align
the authorities, roles, responsibilities, and relationships among the BOT,
Students, Classified Staff, Faculty, and Administrators. Stakeholders have
shared roles, that is, roles shared by all members, functional/operational
roles within the institution, and governance roles within the Governance
System. The Governance System is responsible for college policy, planning and assessment. See Recommendation
1 for additional information on the Governance System.
OC’s
Strategic Plan is a living document that will be continually updated
throughout the planning process and used as a tool to enable the college to
accomplish it shared goals. A key objective
of the Strategic Planning process is to connect the dots between major
strategic initiatives taking place at the college. This includes, but is not
limited to Achieving the Dream, Guided Pathways, and Accreditation. Division and department level plans are
shared across the college to increase transparency and foster collaboration and
annual assessment is built into the process. The new Budget Council will be
considering how to connect the strategic plan with resource allocation.
In tandem, these two efforts will provide frameworks for decision-making,
resource allocation, collaboration, engagement, and collective investment in the
mutual goals of fulfilling OC’s vision, mission, values, student success, and
institutional effectiveness.
Institutions
which have been asked to address prior recommendations or which have been asked
to address any transitional efforts to the 2020 Standards may be included in an
Addendums section.
Improve transparency and college-wide involvement of all
constituencies to increase investment in strategic decision-making through a
comprehensive review and revision of its shared governance policies and
procedures that include: Clear identification of roles, responsibilities, and
authority of the president, administrators, staff, and faculty with particular
attention on identifying the executive responsibilities of the president, the
primary operational responsibilities of administrators and staff, and the
primary instructional responsibilities of the faculty. (2020 Standard 2.A.1)
One of the goals that President Cavalluzzi had when he
started at OC in February of 2018 was to replace the existing committee system
with an effective participatory governance system to enhance transparency and
participation of all stakeholder groups in reviewing and developing college
policies and procedures. To meet this
goal and to address this recommendation, the Board of Trustees approved a
policy in October 2019 on Participatory Governance that authorized the
President to start development of a governance system. Focus groups were conducted in order to assess the state of decision-making processes at
OC. A Governance Task Force was
initially convened in December of 2019 that included representatives from
stakeholder groups including administration, tenured and adjunct faculty, classified
staff, Poulsbo and Shelton campuses, and faculty and staff unions. This task force worked with two consultants
to develop a governance model and clearly define the roles, responsibilities,
and authority of the president, administrators, staff, and faculty. Drafts of the model were shared with
stakeholder groups for feedback to inform the work of the task force. The Governance
Task Force’s final recommendations were accepted
by President Cavalluzzi in April 2021.
The Governance System includes an overarching Governance
Coordinating Council and five functional councils that will be co-chaired by
the Executive administrator and either a student, classified professional
or faculty member. The five functional councils will be Budget, Learning,
Student Advancement, Data and Technology, and Facilities and Safety. Each of
the Councils includes representatives from the Diversity Advisory Committee, the
Sustainability Advisory Committee, faculty, classified staff, students, and
exempt.
The Governance Coordinating Council will be responsible
for forwarding policy and plans to the President. The Executive Team (E-Team),
made up of the President and his direct reports, will develop plans for
implementation. E-Team will be expected to consult with Governance Councils
about approaches to implementation, but such consultations will not be subject
to the consensus decision-making protocols practiced in the College Governance
System. The Faculty Senate is a board-approved body in compliance with RCW 28B.50.145 with a communication link to the Governance Coordinating
Council and a reporting link to the College President. Where appropriate,
policy and implementation recommendations/decisions among President,
Governance, and E-Team will be presented to the Board of Trustees. In some
cases, authority will reside with the President, in alignment with Board
policy.
Image 1
illustrates the relationships and communication between and among the various
governance groups. This includes
reporting relationships, communication links, and relationships in terms of
influence and representation. (See image description.)
Image 1. Relationship of Advisory Committees to
Governance Structure
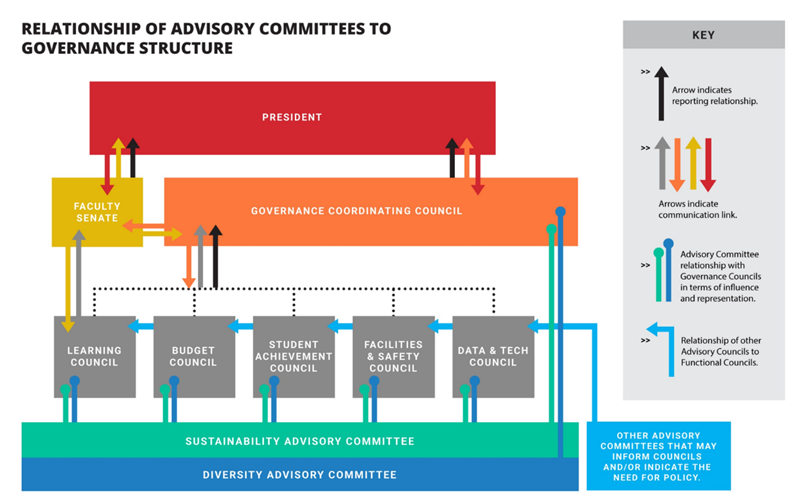
An Implementation Team, including some members from the
Task Force, is developing an Implementation Manual which will further describe
topics such as appointment procedures; lateral and vertical communications
lines; decision making process; council charters; and workplans.
Next steps and timeline
·
Appointments to the Governance Coordinating Council and the Functional
Councils will be initiated over the summer of 2021 and finalized following
faculty and students returning in September.
Governance training will be provided to ensure that all council members
are informed about how the governance system will operate.
·
An all-college forum is planned during Opening Days in September 2021.
·
An end-of-year assessment of the effectiveness of the governance system is planned for May of 2022. This assessment will be repeated annually.
Define procedures for evaluating the alignment and
integration of institutional planning and the allocation of resources for
achieving the intended outcomes of programs and services with respect to
accomplishment of core theme objectives. (2020 Standards 1.B.1, 1.B.3)
Strategic
planning efforts for this strategic planning cycle (2021-2026) incorporate
several college-wide efforts into a holistic plan for better alignment with the
budget cycle. This planning process was centered on an equity framework and
uses the Society for College and University Planning (SCUP) integrated planning
model. This planning model requires alignment between departments and routine
measures and reporting to ensure work is assessed on an ongoing basis. This
process also follows a defined communication plan with multiple communications,
forums, and opportunities for communication with the college community. Departments
and divisions were asked to create annual work plans with measures and routine
reporting in order to monitor progress, identify and
share successes, and ensure effective ongoing collaboration between
stakeholders. Draft work plans are prepared and shared via the Strategic Planning
Sharepoint site for transparency and ongoing
reporting.
OC is
currently planning the implementation of a new shared governance structure
during the 2021-22 academic year (see Recommendation 1 for details.) This
shared governance structure defines college policy making as a board
prerogative, college operational policy making as the responsibility of a
shared governance council, and policy implementation as the responsibility of
administration. Additionally, the Board of Trustees reviewed its current slate
of college policies and has identified a prioritized list of policies in need
of review and refreshment as needed. This operational policy review work and
draft strategic plan will be a starting point for the Governance Coordinating
Council.
OC used ad hoc
budget councils for two years while the governance system was being developed. As
OC prepares for implementation of the new Budget Council this year, the E-Team
is using a rubric based on the draft strategic goals to make budget
allocations. The typical budget cycle used has required submissions of budget
requests by January, with evaluation and allocation taking place by April so
that annual budgets can be drafted on time for the next fiscal year. Both
permanent and temporary funds have been allocated in this manner. This has
sometimes resulted in an unclear path to temporary funding at other points in
the year. One of the first tasks for the new Budget Council will be to decide
if permanent and temporary allocations should be split into two separate budget
request cycles. The ad hoc budget council suggested a separate allocation
process be developed and used for new innovative projects, which could coincide
with the temporary funds allocation cycle.
Systematically evaluate its non-instructional programs
and services to provide direction for the institution that leads to
accomplishment of its core themes, and fulfillment of its mission. (2020
Standard 1.B.1)
OC continues to develop a comprehensive evaluation system
of non-instructional programs and services that focuses on the overall quality
and the cumulative contribution of a program towards mission fulfillment. Several
factors impacted the anticipated goals and progress relating to this evaluation
including increased workhour demands related to institution-wide preparation
for the shift to the statewide enterprise management system (ctcLink), as well
as shifting budget contexts and demands of COVID-19 responses However, OC has also made progress on
strategic planning and directions, which will significantly inform divisional workplans
and the ability to effectively plan and coordinate evaluation work.
While evaluation of non-instructional programs and
services continues within each division, the context for this work shall be
significantly informed by the advent of a shared governance system, which is
anticipated to be formed in earnest in Fall 2021. Shared governance processes
will support not only the evaluation of non-instructional services and programs
within the Budget, Data & Technology, Student Achievement, Facilities &
Safety, and Learning councils, but also coordinate a system across those
councils as well. Coordinating through this shared governance framework will
promote integration of services, consistency, predictability, and information
sharing.
As an example, in Student Services, each program
completed a program review consistent with prior iterations of OC’s strategic
resource allocation program review process. The division’s Student Services
Leadership Council has also established an Assessment Sub-committee, which will
look at developing a divisional approach to both evaluating services and
assessing student learning and support outcomes. Representatives of each
program area also engaged in an 8-week/module online assessment course provided
by Student Affairs Assessment Leaders (SAAL) in March 2021. In conjunction with
this course, programs and departments developed work plans that included goals,
metrics, and deliverables, which are coordinated with assessment and strategic
planning activities. Programs and departments will continue to work with the
Office of Institutional Effectiveness to determine the availability, selection,
and integrity of data sources and measures. The division has also invested in
implementing a self-study process in alignment with the standards for student
affairs, as established by the Council for the Advancement of Standards (CAS)
in Higher Education and is currently drafting proposed assessment and
evaluation schedules to be aligned with anticipated College processes.
In Fall
2021-22, OC will be drafting evaluation tools and processes for the assessment
of non-instructional programs. The goal is to develop a system of comprehensive program
reviews, including a self-study, internal/external evaluation, and report of
findings.
Implement an effective, regular, and comprehensive system
of assessment of student learning outcomes at the course, program, degree,
general education, and related instruction levels, and use the results to
inform academic and learning-support planning and practices that lead to
enhancement of student learning achievements. (2020 Standards 1.C.5, 1.C.7)
The recommendation received after the NWCCU Mission
Fulfillment review was not unexpected. Although much prior work that decade had
been devoted to thoughtful assessment of Core Abilities at biannual institutes,
this work did not constitute an “effective, regular, and comprehensive system”
of assessing learning outcomes at every level. Faculty also individually and
often informally collected evidence of student learning against stated
outcomes, but by 2018 no formal reporting mechanisms had yet been established.
In Summer 2019, a team of deans and faculty convened to
write a collegewide Learning Assessment Action Plan to develop a more robust,
sustainable, and transparent system of learning outcomes assessment. The plan called for three main areas of focus:
Policy and Procedure, System Design/Architecture, and Professional Development.
Each of these areas has received significant attention. While OC has already
addressed aspects of Recommendation 8, much more is currently underway despite
the pandemic.
Policy and Procedure
This area
includes:
·
Developing a shared vocabulary and a common
understanding of goals, methods, policies, and procedures—and how we use results;
·
Implementing a clear process to support writing
measurable course and program outcomes and for reviewing those outcomes;
guidelines and professional development will be offered to coordinate this effort;
·
Scaling use of Canvas to document learning
assessment results; report those results; and archive assessment artifacts;
document potential workflows to/from Canvas and the current curriculum management
system, Curricunet, and;
·
Clarifying roles and responsibilities in shared
governance among stakeholders: faculty, deans, Institutional Effectiveness,
instructional committees (IAC, FCC, IPPR), assessment coordinator, Center for
Learning Innovation, etc.
The Instructional Assessment Council (IAC) guides and
supports a faculty-led assessment process both to continually improve teaching
and learning and to help OC meet accreditation standards. The IAC charter is
revised annually to reflect an evolving understanding of the council’s role,
particularly in relation to the Faculty Curriculum Committee (FCC) and
Instructional Program Planning and Review (IPPR) Committee. In 2018-19, gaps in
responsibilities and workflows were identified by an inter-committee workgroup
with membership from all three committees. As a result of this work, the IAC
added responsibilities for reviewing and approving learning outcomes not tied
to a specific course or program, such as general education outcomes and core
abilities. IAC chairs were also added to technical review approvals in the
curriculum management software. Finally, an IAC workgroup formed in 2019-2020
with the goal of drafting a peer review process for ensuring new course and
program learning outcomes met specific criteria in order to
create a quality baseline. However, due to the pandemic, this workgroup
disbanded without meeting its goal.
In 2020-2021,
the Instructional Assessment Council (IAC) worked with the Instructional
Program Planning and Review (IPPR) Committee to add two prompts to IPPR’s
5-year program review questionnaire:
· Provide evidence of program learning outcomes assessment
collected over the past 5 years; and
· Describe your program improvement plan based on the
evidence collected.
In Spring 2017 - Fall 2018, the Center for Teaching &
Learning (now Center for Learning Innovation) ran a pilot program with some 20
faculty to study the promise of representing course learning outcomes in the
Canvas learning management system. This pilot yielded promising results but was
not scaled due to lack of staff support. However, with increased staffing, the
Center for Learning Innovation imported learning outcomes for every course at
OC into the Canvas Learning Management System (LMS). This months-long effort
gives all faculty at OC a clear-cut way to collect student learning data for
any outcome across multiple sections, with CSV exports for easy conversion to
useful pivot tables and charts. Program learning outcomes are now being
verified in preparation for import. Center eLearning faculty are also
working with faculty subject matter experts to create Canvas-based repositories
by program to store evidence of student learning. These repositories will be
easy to access with one click from a shared Canvas site. The shared site will
be linked in the Center’s Training and Resources Canvas hub. In addition,
Center staff have built common surveys to capture faculty assessment reports on
a periodic basis.
As the college moved from Curricunet to a new curriculum
management system, Curriculog, IAC developed learning outcomes formatting
requirements and best practices guidelines for writing learning outcomes that
faculty will use when they propose new or revised course and program proposals.
At the same time, OC continued to work on a new shared
governance model. This model, with its proposed new Learning Council, may shape
other councils/committees like IAC and IPPR. Chairs of these bodies are aware
of the need for strategic alignment and will continue to monitor as the shared
governance model is fleshed out and implemented, expected Fall, 2021.
System Design/Architecture
This area
includes:
·
Integrating the development of the Diversity and
Social Justice (DSJ) graduation requirement into the larger assessment system design;
·
Formally adopting and publishing distribution
level learning outcomes in humanities, social sciences, and natural sciences;
map course level outcomes to distribution outcomes and assessments as relevant,
and;
·
Revising and simplifying outcomes
architecture—i.e., where do course, program, distribution, Core Abilities, etc.
“live” and how should outcomes at these levels be aligned.
In Spring 2017 - Fall 2018, academic transfer faculty
developed draft distribution
area learning outcomes representing
Humanities, Natural Science, and Social Science distributions in general
education. These outcomes filled a “missing middle” in programmatic assessment
of general education, positioned between the course and core abilities levels.
In 2018-2019, new Diversity and Social Justice (DSJ)
outcomes were approved by the Faculty Curriculum Committee (FCC) in
anticipation of a new DSJ graduation requirement. In 2019 - 2020, the
Instructional Assessment Council voted to sunset the core abilities graduation
requirement (not the core abilities themselves), which it determined to be
burdensome to students, difficult to track, and unhelpful for assessing student
achievement. Beginning in Fall 2021, the DSJ graduation requirement will stand
alone as an additional requirement for graduation with a transfer degree from OC.
In Spring 2021, faculty leads for guided pathways
completed program maps, outlining course sequences and mapping courses to
program outcomes. This work was especially challenging for academic transfer
faculty, many of whom had not been accustomed to thinking of the DTA degree in
terms of “programs.” This mapping led faculty to reexamine and, in some cases, revise
the distribution area learning outcomes developed in 2018-2019 to better
reflect student learning goals.
Professional Development
This area includes:
·
Providing multifaceted professional development
offerings through quarterly Institutes for Inquiry and Innovation, faculty
learning communities, faculty development courses;
·
Offering introductory, intermediate, and
advanced levels, with on-ramps for faculty new to the work; opportunities to progress,
model, and mentor, and;
·
Developing a communication plan to make
transparent a coherent, interconnected program of Professional Development for
assessment.
OC has integrated assessment-related professional
development opportunities into the regular academic calendar. These
opportunities now include two formal Assessment Days, non-instructional
contract days for full-time faculty in November and May. Adjunct faculty
receive stipends for participation. Agendas for these days feature facilitated
sessions, such as workshops and roundtables on the Transparency in Learning and
Teaching (TILT) framework, formative assessment, use of Canvas Outcomes,
authentic assessment, and integrative learning. Agendas also incorporate time
for disciplines and programs to meet to analyze evidence and progress for their
own assessment plans. This work is documented through work
plans and post-meeting reports, now archived in Canvas. The Center for Learning Innovation offers additional
synchronous and asynchronous opportunities throughout the year to learn about
outcomes assessment or engage in best practices. These opportunities are
promoted via email, and links and resources are hosted within the Center’s
Training and Resources Canvas hub.
In 2020-21, OC held two faculty Assessment Days,
including the inaugural May Assessment Day. On May 14, faculty were shown how
to add learning outcomes for their courses within the Canvas LMS. Center
faculty are assisting teaching faculty across divisions in Spring 2021 with
adding outcomes to rubrics, collecting evidence, downloading
artifacts/exporting data, and analyzing findings. This evidence of student
learning will then be added to easy-access program-specific repositories.
IAC co-chairs Martin Cockroft (Center for Learning
Innovation) and Allison Phayre (Office of Institutional Effectiveness) are
2020-2021 NWCCU Mission Fulfilment Fellows. Their project seeks to encompass
Recommendation 8 work as part of clarifying and aligning the college’s major
pieces of work. OC’s eight recommendations revealed the college’s extensive
gaps in institutional structures, processes, and roles. The breadth of these
gaps renders much of the college paralyzed, as employees struggle to understand
the scope of the problems and identify solutions across a multi-year timespan.
Allison and Martin are collaborating to define the scope, interdependencies,
and timing for extensive collegewide work items in response to NWCCU
recommendations, SBCTC system wide work, and the college’s focus on closing
equity gaps and increasing credential attainment.
Next Steps and Timeline
Summer 2021
·
Update Learning Assessment Action Plan for 2021 – 2023
·
Develop Assessment Repositories for each discipline and program to use
beginning Fall 2021
·
Refine curriculum workflows from Faculty Curriculum Committee (FCC) to
Center for Learning Innovation to ensure Canvas Outcomes reflect new and recent
changes to learning outcomes
Fall 2021
·
Offer Faculty Institute for Inquiry and Innovation week of September 6
– 10 to help faculty prepare assessment plans for 2021-2022 academic year and
familiarize faculty with tools and support; offer Faculty Institute November 24
to continue assessment work
·
Clarify program learning outcomes assessment reporting expectations for
faculty submitting IPPR program review questionnaires in 2021-2022; identify
program assessment exemplars to use as models demonstrating evidence of student
learning
·
Pilot Instructional Assessment Council (IAC) course learning outcomes
peer review process for select new and revised course proposals submitted to
FCC in 2021-2022
Winter 2022
·
Pilot Canvas-based course assessment report built into term course
shells
·
Select key courses in distribution areas and courses meeting DSJ
graduation requirement (planned for implementation in Fall 2022) for general
education assessment
·
Determine which college committee (e.g., IAC, IPPR) will define
general education assessment reporting requirements and assessment results
Spring 2022
·
Offer Faculty Institute for Inquiry and Innovation on May 13, 2022, to
give faculty time to review evidence of student learning and plan strategies
for improvement
·
Review results of course outcome peer review pilot and course
assessment report pilot
·
Solicit feedback from faculty submitting program learning outcomes
reports through IPPR in 2021-2022
·
Assess completed work in 2021-2022 against Learning Assessment Action
Plan goals
A.
Mission Fulfillment Indicators
Student Access and Success
Table A1. Student Course Completion
Rates
|
Population
|
2018-19
|
2019-20
|
2020-21
|
2025 Target
|
|
Entire College
|
89%
|
89%
|
90%
|
TBD
|
|
Asian
|
91%
|
92%
|
93%
|
93%
|
|
Black/African
American
|
81%
|
81%
|
84%
|
90%
|
|
Hispanic
|
85%
|
83%
|
88%
|
90%
|
|
Native
American/Alaskan Native
|
82%
|
82%
|
85%
|
90%
|
|
Native Hawaiian
or Pacific Islander
|
90%
|
88%
|
82%
|
90%
|
|
White
|
89%
|
90%
|
90%
|
90%
|
Table A2. Student Completion 15cr. in
Year 1
|
Population
|
2018-19
|
2019-20
|
2020-21
|
2025 Target
|
|
Entire College
|
46%
|
48%
|
N/A
|
50%
|
|
Asian
|
49%
|
50%
|
N/A
|
50%
|
|
Black/African
American
|
35%
|
36%
|
N/A
|
50%
|
|
Hispanic
|
44%
|
36%
|
N/A
|
50%
|
|
Native
American/Alaskan Native
|
18%
|
33%
|
N/A
|
50%
|
|
Native Hawaiian
or Pacific Islander
|
26%
|
50%
|
N/A
|
50%
|
|
White
|
46%
|
50%
|
N/A
|
50%
|
Table A3. Student Completion
- 30 cr. in Year 1
|
Population
|
2018-19
|
2019-20
|
2020-21
|
2025 Target
|
|
Entire College
|
27%
|
28%
|
N/A
|
TBD
|
|
Asian
|
27%
|
39%
|
N/A
|
TBD
|
|
Black/African
American
|
21%
|
11%
|
N/A
|
TBD
|
|
Hispanic
|
19%
|
13%
|
N/A
|
TBD
|
|
Native
American/Alaskan Native
|
6%
|
14%
|
N/A
|
TBD
|
|
Native
Hawaiian or Pacific Islander
|
13%
|
39%
|
N/A
|
TBD
|
|
White
|
29%
|
30%
|
N/A
|
TBD
|
Table A4. Completion by
Year 3 (equiv. 150% time) for Academic/Transfer Intents
|
Population
|
2018-19
|
2019-20
|
2020-21
|
2025 Target
|
|
Entire College
|
22%
|
21%
|
20%
|
25%
|
|
Asian
|
39%
|
24%
|
30%
|
25%
|
|
Black/African
American
|
10%
|
14%
|
14%
|
25%
|
|
Hispanic
|
9%
|
15%
|
17%
|
25%
|
|
Native
American/Alaskan Native
|
N/A
|
0%
|
20%
|
25%
|
|
Native
Hawaiian or Pacific Islander
|
27%
|
25%
|
33%
|
33%
|
|
White
|
22%
|
23%
|
20%
|
25%
|
Table A5. First time pass rates on
standardized and national state exams
|
Program
|
2018
|
2019
|
2020
|
2025 Target
|
|
Associate
Degree, Nursing
|
95%
|
96%
|
N/A
|
>80%
|
|
Medical
Assisting
|
N/A
|
N/A
|
72%
|
>65%
|
|
Nursing Assistant
|
70%
|
73%
|
94%
|
>80%
|
|
Practical Nursing
|
92%
|
83%
|
N/A
|
>80%
|
|
Physical
Therapist Assistant
|
97%
|
92%
|
95%
|
>90%
|
Table A6. Overall pass rates on
standardized and national state exams
|
Program
|
2018
|
2019
|
2020
|
2025 Target
|
|
Associate
Degree, Nursing
|
N/A
|
N/A
|
N/A
|
N/A
|
|
Medical
Assisting
|
100%
|
97%
|
71%
|
>64%
|
|
Nursing Assistant
|
N/A
|
N/A
|
N/A
|
N/A
|
|
Practical Nursing
|
N/A
|
N/A
|
N/A
|
N/A
|
|
Physical
Therapist Assistant
|
100%
|
100%
|
100%
|
N/A
|
Table A7. Students completing
OC baccalaureate programs, total
|
Program
|
2018-19
|
2019-20
|
2020-21
|
2025 Target
|
|
Digital Film
|
94%
|
100%
|
94%
|
>94%
|
|
Information
Systems
|
100%
|
N/A
|
80%
|
>90%
|
|
Nursing
|
N/A
|
N/A
|
N/A
|
>70%
|
|
Org. Leadership
& Tech. Mgmt.
|
100%
|
95%
|
88%
|
>90%
|
Table A8. Basic Studies – Outcomes
after exit
|
Program
|
2018-19
|
2019-20
|
2020-21
|
2025 Target
|
|
Attained
a secondary diploma and postsecondary credential within one year of exit
|
71%
|
52%
|
N/A
|
TBD
|
|
Attained
any credential
|
40%
|
36%
|
N/A
|
TBD
|
|
Employment
2nd quarter after exit
|
28%
|
39%
|
N/A
|
TBD
|
|
Employment
4th quarter after exit
|
28%
|
36%
|
N/A
|
TBD
|
Overall
completion and credit attainment data shows that there are equity gaps in
student achievement that need to be addressed.
Pass rates on standardized and national state exams are consistently at
or above the targets based on national averages.
Baccalaureate
degree completion fluctuates by program.
·
Digital Film (BAS-DF): Student completion rates
are consistently high, sometimes 100%.
·
Information Systems (BAS-IS): Many BAS IS students accept full-time employment while in the BAS
program. To accommodate work schedules, they sometimes reduce their school
class loads by waiting to enroll in general education courses until after their
cohort graduates. This impacts the on-time completions.
·
Nursing (BSN): Unlike the other programs,
Nursing on-time completion is 4 years instead of 2 years. This is a challenging
program as indicated by the fluctuations in completions.
·
Organizational Leadership & Technical
Management (BAS OLTM): Although most students complete on time, a few complete
in subsequent years.
For Basic
Studies, the fluctuations in data can be partly attributed to fluctuations in
the political and economic climate at a regional and national level as well as
the COVID-19 pandemic.
·
Attained a Secondary School Diploma/Recognized
Equivalent and Postsecondary Credential Within One Year of Exit: For 2018,19,
OC was at 70% which is slightly higher than the state average of 63% for this
period. For 2019-2020, it was 52%
compared to a state average of 64%.
·
Attained any credential unduplicated: For
2018-19, OC was at 40% compared to a state average if 52%. For 2019-2020, it
was 36% compared to a state average of 53%.
·
Employment 2nd Quarter After Exit: On average,
32% of the former program participants were employed the 2nd quarter after exit
over the past three years, compared to a state average of 27%.
·
Employment 4th Quarter After Exit: On average
31% of the former program participants were employed the 4nd
quarter after exit over the past three years, compared to a state average of
28%.
Teaching and Learning
Table A9. Student Perceptions of Quality
of Interactions/Relationships with Instructors
|
Indicator
|
2018-19
|
2019-20
|
2020-21
|
2025 Target
|
|
Course evaluations on instructor interaction, 5 =
mostly
|
N/A
|
N/A
|
82%
|
TBD
|
Table A10. Faculty Completion of Professional Development Plans (PDP)
|
Indicator
|
2018-19
|
2019-20
|
2020-21
|
2025 Target
|
|
Professional Technical PDP
|
95%
|
87%
|
89%
|
100%
|
Table A11.
Faculty Participation in Professional Development and Training
|
Indicator
|
2018-19
|
2019-20
|
2020-21
|
2025 Target
|
|
Transparency in Learning and Teaching (TILT) workshop
|
27
|
31
|
N/A
|
TBD
|
|
Assessment Institutes participation
|
127
|
77
|
248
|
TBD
|
|
Equity Institutes
|
53
|
30
|
7
|
TBD
|
OC moved to a new faculty
evaluation tool and only Winter and Spring 2021 quarters are available. Two
questions were selected: 3.2 Instructor interactions were available and helpful
and 3.6 I felt free to ask questions. More
data will need to be gathered to determine an adequate target. The CCSSE survey
was not administered in 2020 due to COVID-19, but future years will be included. Faculty completion of PDPs remains a
challenge. Data on the PDPs required
upon completion of tenure and post-tenure review are not available at this time
but will be included in the future. While the number of professional
development and training offerings may also vary year to year, thus impacting
the participation numbers, the intent is to look at the cumulative impact over
multiple years.
Institutional Capacity Building
Table A12.
Ongoing partnerships and collaborations with community
|
Indicator
|
2018-19
|
2019-20
|
2020-21
|
2025
Target
|
|
Advisory Group meetings
|
100%
|
100%
|
100%
|
100%
|
|
High School Articulation
Agreements
|
119
|
124
|
179
|
>150
|
As in previous
years, 100% of advisory committees met a minimum of twice a year. In 2019-20, this includes two committees that
received a pandemic waiver for their second meeting from the State Board of
Community and Technical Colleges. The number of active High School Articulation
Agreements continues to grow. For
2018-19, there were 11 new agreements. For 2019-20, 20 were new and for
2020-21, 34 were new.
B. Early Childhood Education Key Assessment
Alignment
Early Childhood Education Key
Assessments by Course
|
Course #
|
Course Title
|
Offered
|
Key Assessment Assignment
|
NAEYC standard met
|
|
ECED&
120
|
Practicum
I
|
F, W, Sp
|
|
|
|
ECED&
107
|
Health,
Safety and Nutrition
|
Su, F, W
|
|
|
|
ECED&
105
|
Introduction
to Early Childhood Ed
|
F, W, Sp
|
Research
project on a topic in early childhood (of the student’s choosing) that
demonstrates knowledge of a trend or issue impacting the field of early
learning.
|
6d. Integrating knowledgeable, reflective, and
critical perspectives on early education.
|
|
EDUC&
121
|
Child
Development
|
F, W, Sp
|
Observation
assignments of infants, toddlers and preschoolers and writing a
compare/contrast paper that explains development patterns of growth for
typically developing children.
|
1a. Knowing and understanding young children’s
characteristics and needs.
1b. Knowing and understanding the multiple
influences on development and learning.
|
|
EDUC&
130
|
Guiding
Children’s Behavior
|
F, W, Sp
|
|
|
|
ECED&
139
|
Administration
of Early Learning Prgms
|
Su, W
|
|
|
|
ECED&
132
|
Infant/Toddlers
Caregiving
|
W
|
|
|
|
ECED&
134
|
Family
Child Care
|
W
|
|
|
|
EDUC&
136
|
School
Age Care
|
Su, W
|
|
|
|
ECED&
138
|
Home
Visitor/Family Engagement
|
Sp
|
|
|
|
ECED&
164
|
Mathematics
for Early Childhood Ed
|
F, W, Sp
|
|
|
|
Course #
|
Course Title
|
Offered
|
Key Assessment Assignment
|
NAEYC standard met
|
|
ECED&
160
|
Curriculum
Development
|
Su, W
|
Completion
of a developmentally appropriate thematic curriculum project that includes
the following elements:
·
Goals and student outcomes appropriate for
the age written
·
Schedule and routine of the chosen
developmentally appropriate environment
·
Curriculum map and written lesson plans in
the following content areas: art,
math, science, language arts, sensory, large and
fine motor, social studies, dramatic or creative play
·
Delivery and evaluation of two student
written lesson plans
·
Literature list of appropriate genres/titles
|
1
c. Using developmental knowledge to
create healthy, respectful, supportive, and challenging learning
environments.
4b.
Knowing and understanding effective strategies and tools for early education
4c. Using a broad repertoire of developmentally
appropriate teaching/learning practices.
5a. understanding content knowledge and
resources in academic disciplines.
5b. Knowing and using the central concepts,
inquiry tools, and structures of content areas or academic disciplines.
5c. Using their own knowledge, appropriate
early learning standards, and other resources to design, implement, and
evaluate meaningful, challenging curricula for each child.
|
|
ECED&
170
|
Environments
for Young Children
|
F, W
|
|
|
|
Course #
|
Course Title
|
Offered
|
Key Assessment Assignment
|
NAEYC standard met
|
|
ECED&
180
|
Language
and Literacy Development
|
F, Sp
|
|
|
|
ECED&
190
|
Observation
and Assessment
|
F, Sp
|
|
|
|
EDUC&
150
|
Child/Family
and Community
|
Sp
|
|
|
|
ENGL&
101
|
English
Composition
|
Su, F,
W, Sp
|
Decided
by English faculty
|
NA
|
NAEYC Standards Alignment with Course Key Assessments
In process, to be completed AY 2021-22
Standard
One: Promoting Child Development and
Learning
Candidates
prepared in early childhood degree programs are grounded in a child development
knowledge base. They use their
understanding of young children’s characteristics and needs, and of multiple
interacting influences on children’s development and learning, to create
environments that are healthy, respectful, supportive
and challenging for each child.
|
NAEYC Standards
|
Course(s)
where met
|
|
1a. Knowing and understanding young children’s
characteristics and needs
|
EDUC& 121
Child Development
|
|
1b. Knowing and understanding the multiple
influences on development and learning.
|
EDUC& 121
Child Development
|
|
1c. Using developmental knowledge to create
health, respectful, supportive, and challenging learning environments.
|
EDUC& 160
Curriculum Development
|
Standard Two: Building Family and Community Relationships
Candidates prepared
in early childhood degree programs understand that successful early childhood
education depends upon partnerships with children’s families and
communities. They know about,
understand, and value the importance and complex characteristics of children’s
families and communities. They use this
understanding to create respectful, reciprocal relationships that support and
empower families, and to involve all families in their children’s development
and learning.
·
2a.
Knowing about and understanding diverse family and community
characteristics.
·
2b: Supporting and engaging families and
communities through respectful, reciprocal relationships.
·
2c: Involving families and communities in young
children’s development and learning.
Standard 3. Observing,
documenting, and assessing to support young children and families.
Candidates prepared in early
childhood degree programs understand that child observation, documentation, and
other forms of assessment are central to the practice of all early childhood
professionals. They know about and understand the goals, benefits, and uses of
assessment. They know about and use systematic observations, documentation, and
other effective assessment strategies in a responsible way, in partnership with
families and other professionals, to positively influence the development of
every child.
·
3a: Understanding the goals, benefits, and uses
of assessment – including its use in development of appropriate goals,
curriculum, and teaching strategies for young children
·
3b: Knowing about and using observation,
documentation, and other appropriate assessment tools and approaches, including
the use of technology in documentation, assessment and
data collection.
·
3c: Understanding and practicing responsible
assessment to promote positive outcomes for each child, including the use of
assistive technology for children with disabilities.
·
3d: Knowing about assessment partnerships with
families and with professional colleagues to build effective learning
environments.
Standard
4. Using developmentally effective approaches.
Candidates
prepared in early childhood degree programs understand that teaching and
learning with young children is a complex enterprise, and its details vary
depending on children’s ages, characteristics, and the settings within which teaching and learning occur. They understand and use
positive relationships and supportive interactions as the foundation for their
work with young children and families. Candidates know, understand, and use a
wide array of developmentally appropriate approaches, instructional strategies,
and tools to connect with children and families and positively influence each
child’s development and learning.
·
4a: Understanding positive relationships and
supportive interactions as the foundation of their work with young children
·
4b: Knowing and understanding effective
strategies and tools for early education, including appropriate uses of
technology
·
4c: Using a broad repertoire of developmentally
appropriate teaching /learning approaches
·
4d: Reflecting on own practice to promote
positive outcomes for each child
Standard
5. Using content knowledge to build meaningful curriculum.
Candidates
prepared in early childhood degree programs use their knowledge of academic
disciplines to design, implement, and evaluate experiences that promote
positive development and learning for each and every
young child. Candidates understand the importance of developmental domains and
academic (or content) disciplines in early childhood curriculum. They know the
essential concepts, inquiry tools, and structure of content areas, including
academic subjects, and can identify resources to deepen their understanding.
Candidates use their own knowledge and other resources to design, implement,
and evaluate meaningful, challenging curriculum that promotes comprehensive
developmental and learning outcomes for every young child.
·
5a: Understanding content knowledge and
resources in academic disciplines: language and literacy; the arts – music,
creative movement, dance, drama, visual arts; mathematics; science, physical
activity, physical education, health and safety; and
social studies.
·
5b: Knowing and using the central concepts,
inquiry tools, and structures of content areas or academic disciplines.
·
5c: Using own knowledge, appropriate early
learning standards, and other resources to design, implement, and evaluate
developmentally meaningful and challenging curriculum for each child.
Standard 6.
Becoming a professional.
Candidates
prepared in early childhood degree programs identify and conduct themselves as
members of the early childhood profession. They know and use ethical guidelines
and other professional standards related to early childhood practice. They are
continuous, collaborative learners who demonstrate knowledgeable, reflective and critical perspectives on their work, making
informed decisions that integrate knowledge from a variety of sources. They are
informed advocates for sound educational practices and policies.
·
6a: Identifying and involving oneself with the
early childhood field
·
6b: Knowing about and upholding ethical
standards and other early childhood professional guidelines.
·
6c: Engaging in continuous, collaborative
learning to inform practice; using technology effectively with young children,
with peers, and as a professional resource.
·
6d: Integrating knowledgeable, reflective, and
critical perspectives on early education.
·
6e: Engaging in informed advocacy for young
children and the early childhood profession.
Standard 7. Early childhood
field experiences.
Field experiences and clinical
practice are planned and sequenced so that candidates develop the knowledge,
skills and professional dispositions necessary to promote the development and
learning of young children across the entire developmental period of early
childhood – in at least two of the three early childhood age groups (birth –
age 3, 3 through 5, 5 through 8 years) and in the variety of settings that
offer early education (early school grades, child care centers and homes, Head
Start programs).
·
7a. Opportunities to observe and practice in at
least two of the three early childhood age groups (birth – age 3, 3-5, 5-8).
·
7b. Opportunities to observe and practice in at
least two of the four main types of early education settings (early school
grades, child care centers, family and home-based
child care settings, and Head Start or equivalent programs).